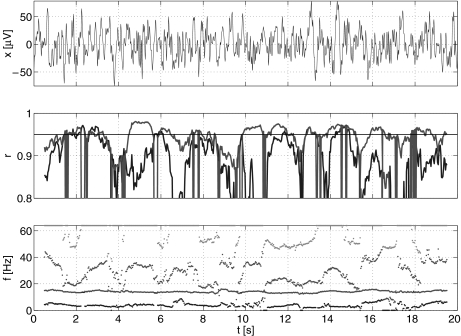
Fig. 3.
Twenty-second simulated AR(4) data with time-dependent modules and frequencies derived by fitting an AR(4) model similar to Fig. 1. The upper panel shows the signal, the middle panel shows r, and the lower panel the corresponding frequencies f, with the colors indicating corresponding oscillatory modes. The AR(4) model contained two oscillatory modes, one in the spindle frequency band, f = 14 Hz, r = 0.94, and one in the delta frequency band, f = 3Hz, r = 0.91

