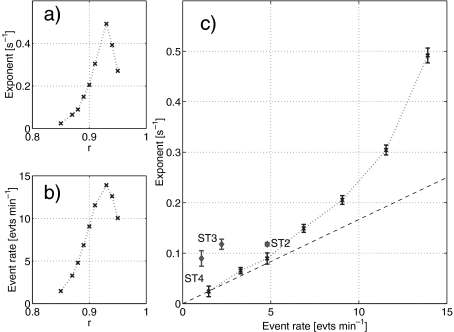
Fig. 6.
a Exponents from the fit of the exponential tails of the interevent interval distributions (Fig. 5) of the simulated AR(4) data as a function of r of the spindle frequency pole. b Event rate as a function of r. c Exponent of the exponential decay (mean ± SD) as a function of the event rate shown only for 0.85 ≤ r ≤ 0.93. Values for the empirical distributions (red) from sleep spindles shown separately for nonrapid eye movement sleep stages 2, 3, and 4. The straight line indicates the linear relationship as expected for a Poisson process

