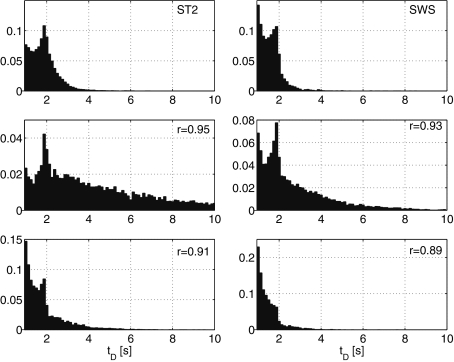
Fig. 7.
Normalized histograms (pooled data) of the event duration (t D) in the spindle frequency range (11.5–16 Hz) in nonrapid eye movement sleep stage 2 (ST2; top left) and slow wave sleep (SWS, stages 3 and 4; top right) and events in the spindle frequency range from a stationary AR(4) process with different values of r for the spindle frequency

