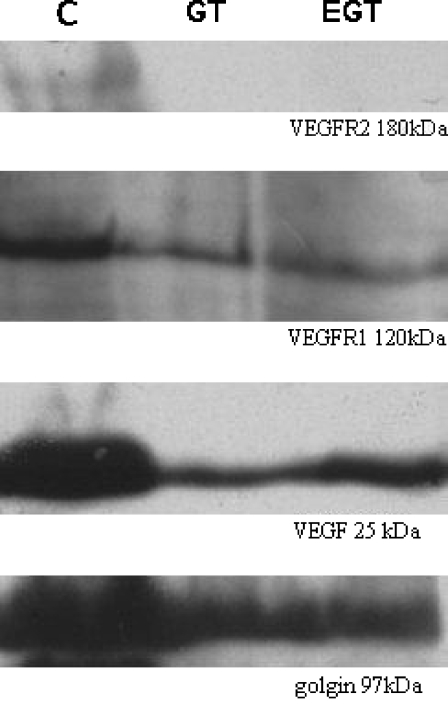
Fig. 5.
Representative bands obtained by western blot analysis of VEGF (25 kDa), VEGFR1 (120 kDa) and VEGFR2 (180 kDa) in corpus cavernosum samples of control (C), green tea (GT) and green tea extract (EGT)-treated rats. Semi-quantitative analysis was carried out by calculating the fraction of pixels presented in the selected band relative to the golgin band in the same sample used as an internal control. All the studied molecules exhibited lower expression in the GT and GTE groups when compared with the control, the decrease in VEGFR2 expression being particularly evident

