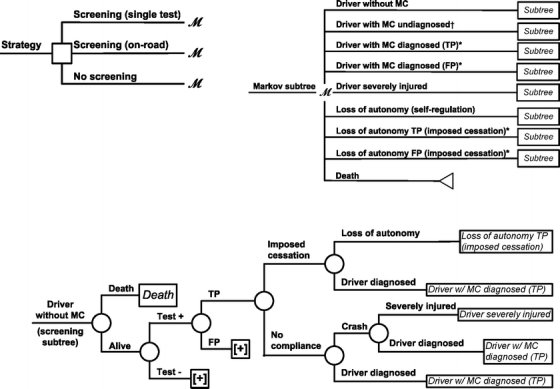
Figure 1.

Simplified Markov decision analysis model (for illustrative purposes, only one cycle-tree is shown). *only related to screening; †only related to no screening; MC = medical condition, FP = false positive, TP = true positive; square = decision node, circles = chance nodes, with “M” = Markov nodes; [+] = continuation of tree not shown.
