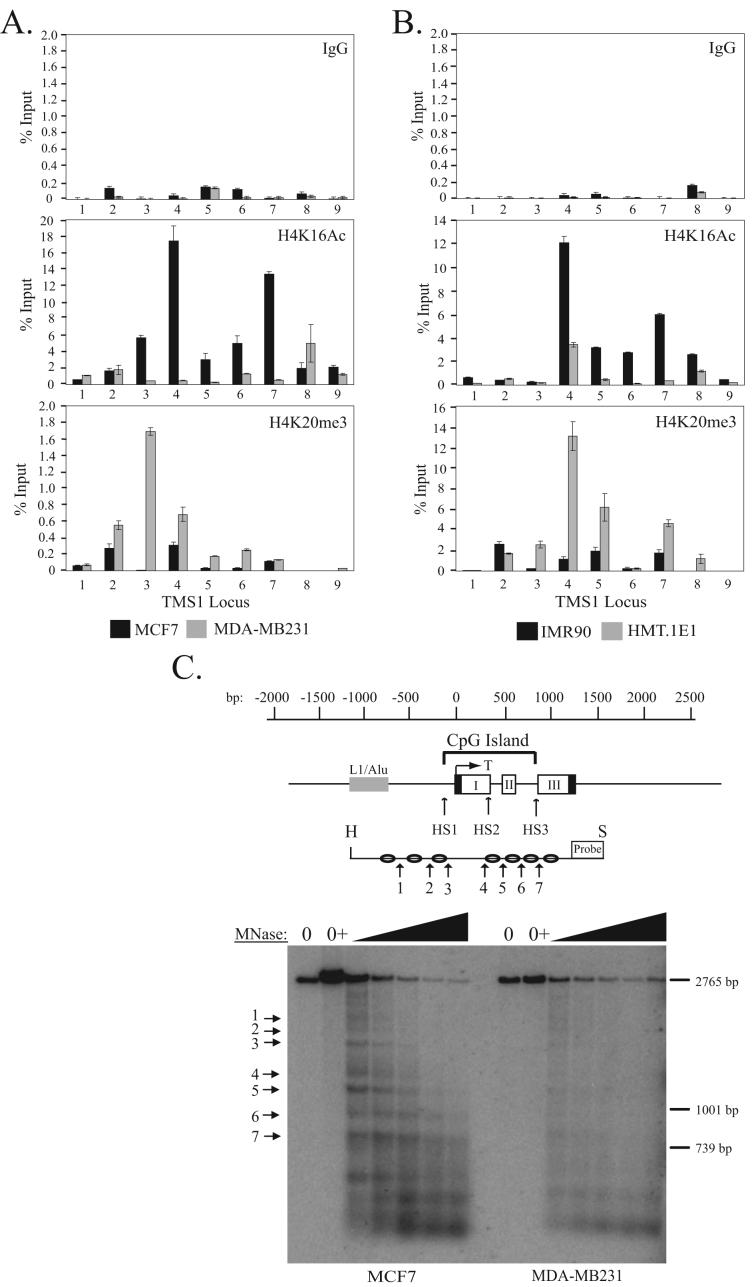
Figure 2.
Localization of H4K16Ac and H4K20me3 across the TMS1 locus. A) MCF7 and MDA-MB231 breast cancer cells or B) IMR90 and HMT.1E1 cell lines were subjected to ChIP with antibodies against rabbit IgG (IgG) or the indicated histone modifications. Immunoprecipitated DNA was amplified by real-time PCR with primer sets indicated in Figure 1A. Percent (%) input was determined as the amount of immunoprecipiated DNA relative to input DNA. Each ChIP was repeated at least three times, and although the immunoprecipitation efficiency varied between experiments, the profile of enrichment across the locus was consistent. Shown are the mean +/- standard deviation of triplicate determinations from a representative experiment. C) Nucleosome positioning at the TMS1 locus. Nuclei from MCF7 (left) or MDA-MB231 (right) cells were incubated in MNase digestion buffer alone (0), digestion buffer plus CaCl2 (0+), or digestion buffer plus CaCl2 and 10-200U MNase. MNase-digested DNA (10 μg) was digested with Hind III (H) and Spe I (S), separated on a 1% agarose gel, and subject to Southern blot analysis using a probe anchored to the 3′ Spe I site. Preferential MNase cut sites are depicted with arrows. Shown is the relative migration of a 2765bp, 1001bp and 739bp Spe I-anchored fragments from the TMS1 locus that were included as internal markers. A representative experiment is shown.

