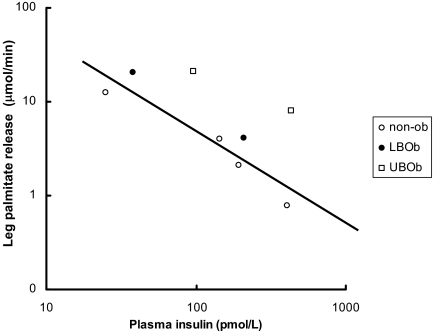
Figure 3.
Data from Meek et al. (35), who performed a series of insulin clamp studies in nonobese (non-ob) adults (see Fig. 1), and Guo et al. (36), who studied regional FFA release before and during meal ingestion, are plotted. The relationship between plasma insulin concentrations and leg palmitate release are plotted on logarithmic axes. The line shows the best fit between values from nonobese and lower body obese (LBOb) volunteers (n = 8). UBOb, Upper body obese (n = 8).

