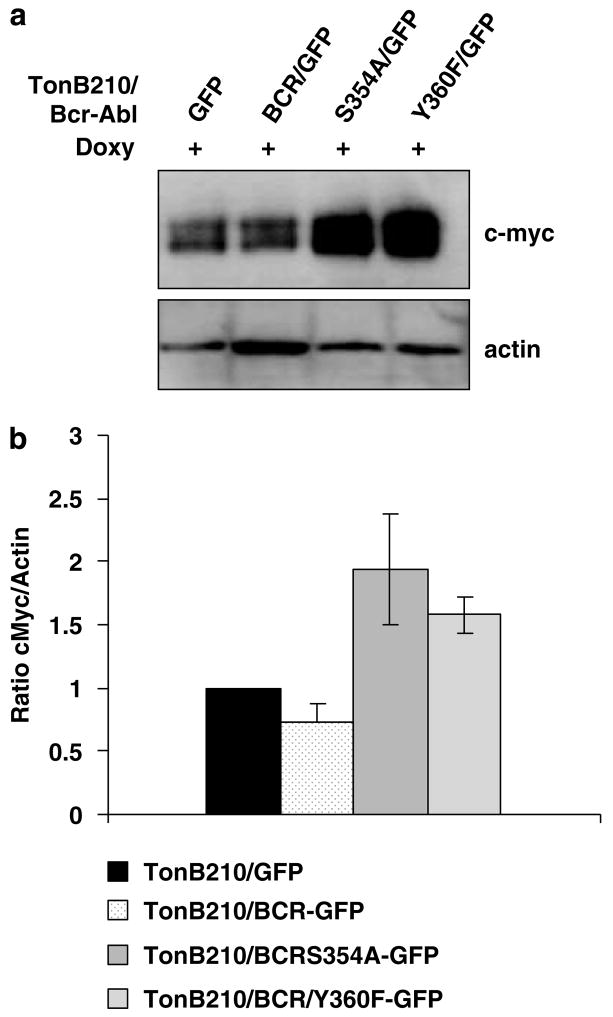
Figure 5.
Kinase domain mutants of Bcr enhance c-Myc expression. (a) The upper panel shows a representative western blot of TonB210 cells with various Bcr proteins and control GFP grown as described in Figure 1. c-Myc was detected by using an rabbit anticMyc (N-262) antibody from Santa Cruz Biotechnology (Santa Cruz, CA, USA). Quantification of protein levels was by volume densitometry using the Scion Image program, and intensity values were normalized for actin content. Five different determinations were averaged for the GFP control and the wild-type BCR groups, and two different determinations were averaged for the S354A and the Y360F groups. (b) Comparison analysis of the intensities of the c-Myc bands showed a significant difference between TonB210/GFP and TonB210/BCR/GFP (P-value = 0.0617), TonB210/BCR/GFP and TonB210/BCRS354A/GFP (P-value = 0.0068), and TonB210/BCR/GFP and TonB210/BCRY360F/GFP (P-value = 0.0004). GFP, green fluorescent protein.

