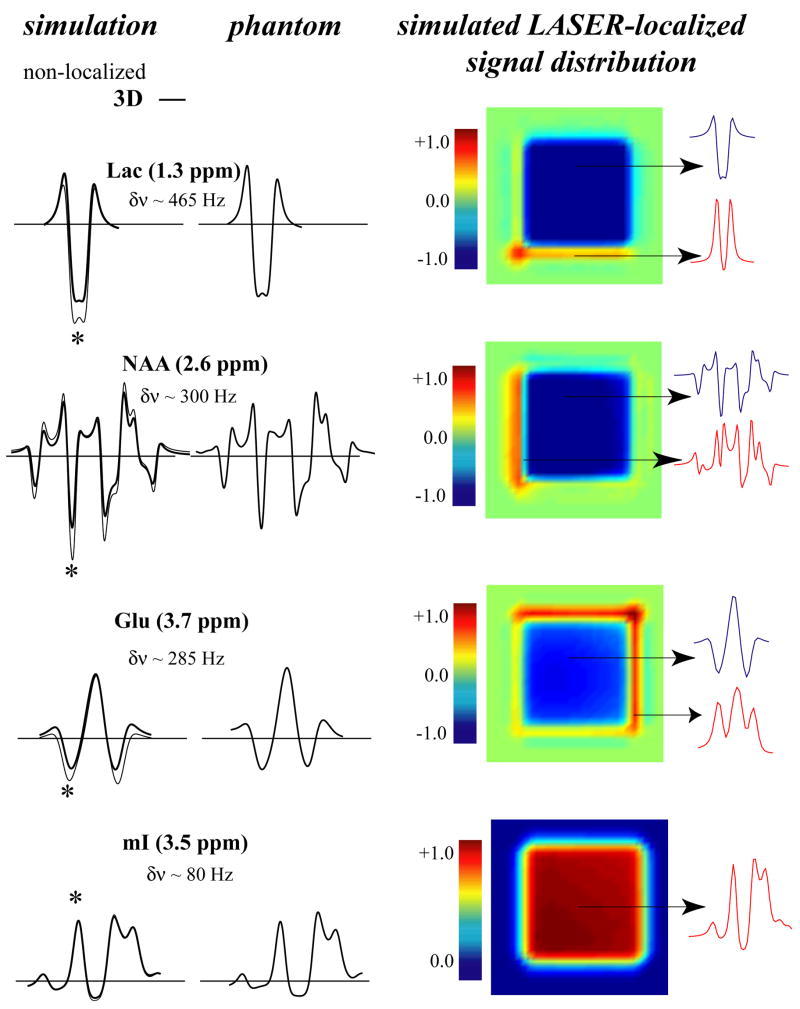
Figure 4.
Left: A comparison of ideal (thin line) and 3D localized (thick line) LASER (TE=70 ms) simulations with experimental 3D LASER-localized phantom spectra of Lac, NAA, Glu and mI. Right: The corresponding signal distribution in a slice from the 3D localized volume. The asterisk (*) denotes the spectral location (10 Hz wide) of the localized signal distribution. The spectral separation between coupled spins is indicated by δν for each metabolite.

