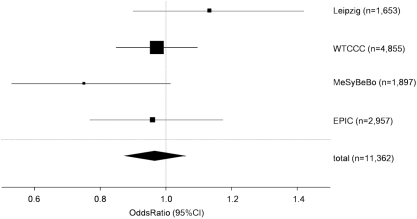
Figure 1. Forest blot presenting the meta-analysis of the study populations EPIC, MeSyBePo, Leipzig and the WTCCC.
The size of each square is proportional to the study's weight within the meta-analysis. The overall effect estimate is plotted as a diamond. The lateral points of that diamond indicate the 95%-CI of this estimate.

