Figure 6.
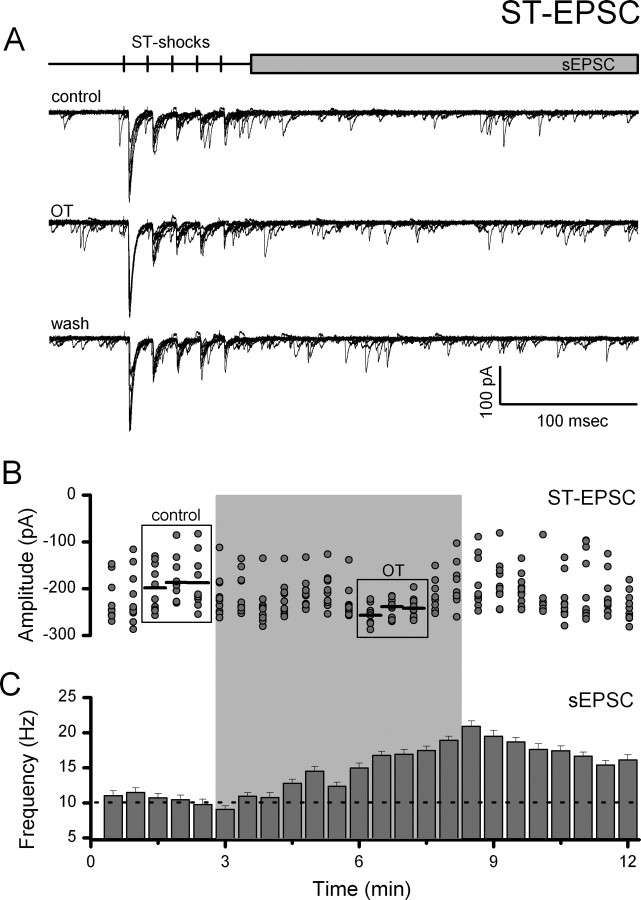
OT increases ST-EPSC amplitude and decreases amplitude variability coincident with increased spontaneous EPSC frequency. A, Representative current traces (10 consecutive traces overlaid) from an OT-sensitive NTS neuron before (control), during (OT, 1000 nm), and after (wash) OT exposure. Experiments were performed in 1 mm Ca2+ ACSF. Top panel, Diagram of recording protocol. B, Plot of individual EPSC 1 amplitudes over time. Gray shading indicates time of OT exposure. OT rapidly and reversibly increased the mean amplitude of ST-EPSCs and decreased variability in OT-sensitive NTS neurons. Comparisons were made between control and peak OT responses (boxes). Horizontal black lines represent average EPSC amplitude. The SE bars have been removed for clarity. C, sEPSCs recorded simultaneously increased in frequency during OT exposure. Frequency data were grouped into 30 s bins and plotted over time. The dotted line represents the average control frequency. The effects of OT on both evoked and spontaneous glutamate release indicate a common presynaptic pathway through which the probability of glutamate release is increased.

