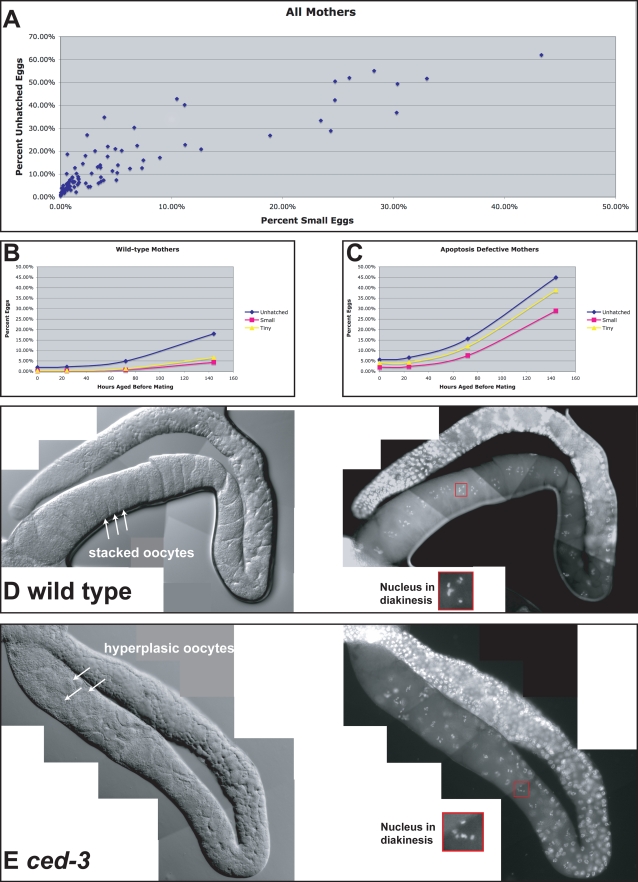
Figure 7. Decreased oocyte quality correlates with decreased oocyte size.
(A) Scatter plot comparing percent embryonic death with percent of small eggs. Each point represents data for females from one set of crosses that were mated at a single age. (B) Percent embryonic death (blue), percent of small eggs laid (pink), and percent tiny, egg-like objects produced (yellow), plotted against the mother's age at first mating. Graph presents combined data for all wildtype mothers, regardless of the genotype of the father. (C) As in B, but the graph presents combined data for all ced-3 and ced-4 mothers, regardless of the genotype of the father. (D) Photomicrographs of the extruded gonad from a wild-type virgin that was aged for 144 hours after maturation. The left panel shows a Nomarski image, the right panel shows the same gonad stained with DAPI, and the inset shows a typical nucleus in diakinesis, which we used as a marker for oocytes in the last phase of development. (E) Photomicrographs of the extruded gonad from a ced-3(n718) virgin female that was aged for 144 hours after maturation. Notice the larger number and smaller size of oocytes in the last phase of development.

