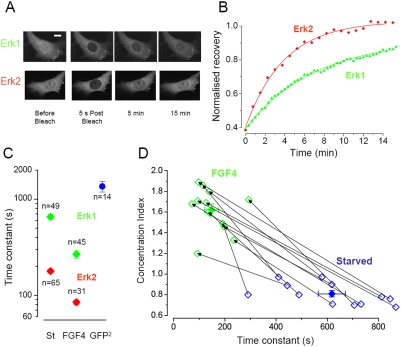
Figure 2. Comparison of the nucleo-cytoplasmic shuttling of ERK1 and ERK2.
A) After photobleaching of the nucleus of starved NIH 3T3 cells, the ERK1 fluorescence recovered more slowly than ERK2, indicating a slower turnover of ERK1 across the nuclear membrane. Calibration bar 10 µm. B) Time course of the recovery of the cells showed in A. The data point were fitted with a single exponential with time constant τ of 235 sec (ERK2) and 430 sec (ERK1). C) Summary data for the sampled cells. The turnover of ERK1 is slower both in starved cells and after stimulation with FGF. In ERK1 starved cells the turnover is 3.7 time slower (653 s) than ERK2 (178 s) and in the stimulated cells ERK1 turnover (266 s) is 3.1 time slower than ERK2 (84 s). The blue symbol shows the turnover for a GFP dimer. This molecule is smaller than ERK-GFP but it crosses the nuclear membrane more slowly than ERK1, indicating that also for ERK1 is operating a mechanism of facilitated diffusion. D) Scatter diagram showing the recovery and Concentration Index of all paired measurements. Lines join observations relative to the same cell before and after stimulation. The filled symbols are the averages of the two groups.

