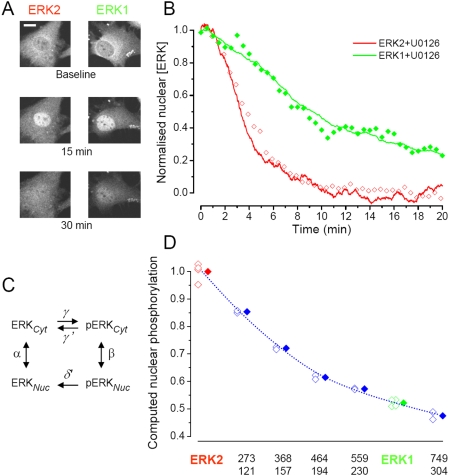
Figure 6. Computational estimate of the functional consequences of the different shuttling rates of ERK1 and 2.
A) Cells transfected with ERK1-GFP and ERK2-GFP were treated with FGF4 for 15 min to allow complete nuclear translocation and then with the ERK blocker U0126. The inactivation of the ERK pathway caused the immediate loss of nuclear accumulation of ERK-GFP unmasking the action of nuclear dephosphorylation. Calibration bar 20 µm. B) By fitting the time course of the decay of nuclear ERK2-GFP (empty red diamonds) with the model output (continuous red line), we could estimate the dephosphorylation rate. This estimate was included in the model together with the shuttling rates measured for ERK1 to predict the outcome of this experiment practiced on the cells transfected with ERK1-GFP. The model prediction (green line) describes with great accuracy the experimental points (filled green symbols). C) Reaction scheme of the model. It has been considered an equilibrium among 4 different states regulated by first order kinetics: pERK and ERK indicates the concentration of the phosphorylated and not-phosphorylated pools in the cytoplasm (Cyt) or in the nucleus (Nuc); the rate constants α and β are the time constant of recovery of FRAP experiments; γ is the phosphorylation rate; γ' and δ' are the dephosphorylation rates, respectively, in the cytoplasm and in the nucleus. D) The model was used to compute the phosphorylation in the nucleus as a function of the shuttling speed. The empty symbols represent the result of a single simulation run and the filled symbols are the averages of each group. The phosphorylation level has been normalized to ERK2, therefore the computation shows that the total level of phosphorylation of ERK1 is only about half of ERK2. The numbers under each set of data points are the time constants (in seconds) of nuclear shuttling in the starved (above) and stimulated conditions (below).

