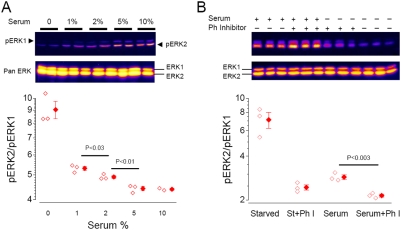
Figure 7. Comparison between the activation of ERK1 and 2.
A) NIH 3T3 cells have been starved for 24 hr before treatment for 15 min with increasing concentrations of serum as indicated. The densitometric analysis of the gel blotted with the phospho-specific antibody has been performed with a linear imager to quantify the intensity of the phospho-ERK1 and 2 bands. From each experiment we computed the ratio pERK2/pERK1 which is a measure of the relative activation of the two kinases. The graphs shows that ERK1 activation lags behind ERK2. B) Effects of phosphatase inhibition on the relative activations of ERK1 and 2. Cells have been starved for 24 hr before a 30 min treatment with serum 10% and/or a cocktail of phosphatase inhibitors. Inhibition of phosphatases in presence of serum caused a further increase of phosphorylation compared to serum only. This increase was larger for ERK1, indicating a stronger dependence of ERK1 on de-phosphorylation. Notice that there is no vertical correspondence between the western blot and the quantification.

