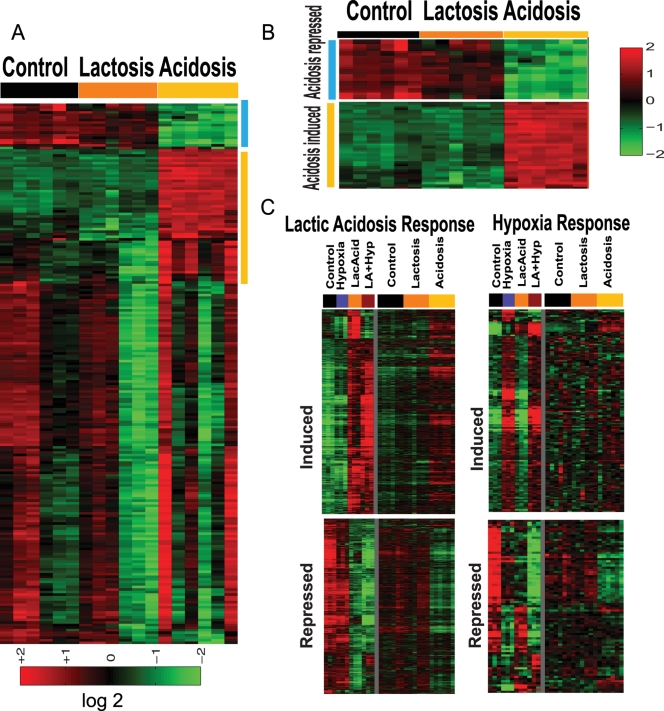
Figure 2. The cellular responses to lactosis and acidosis.
(A) HMECs were exposed to three indicated environments: control, lactosis, and acidosis. 213 genes with expression varied from the mean at least 1.75 fold in 4 samples were selected and hierarchically clustered. A cluster of genes strongly induced by acidosis is shown (yellow vertical bar). (B) The expression of genes comprising acidosis gene signatures under indicated conditions was shown in heat maps. The expression of genes selected by statistical analysis (see Text S1) for whom the probability of an expression change under lactic acidosis (C) or hypoxia (D) exceeds 0.99 were shown under hypoxia/lactic acidosis or lactosis/acidosis. Most lactic acidosis-induced/repressed genes are also induced/repressed by acidosis but not lactosis.

