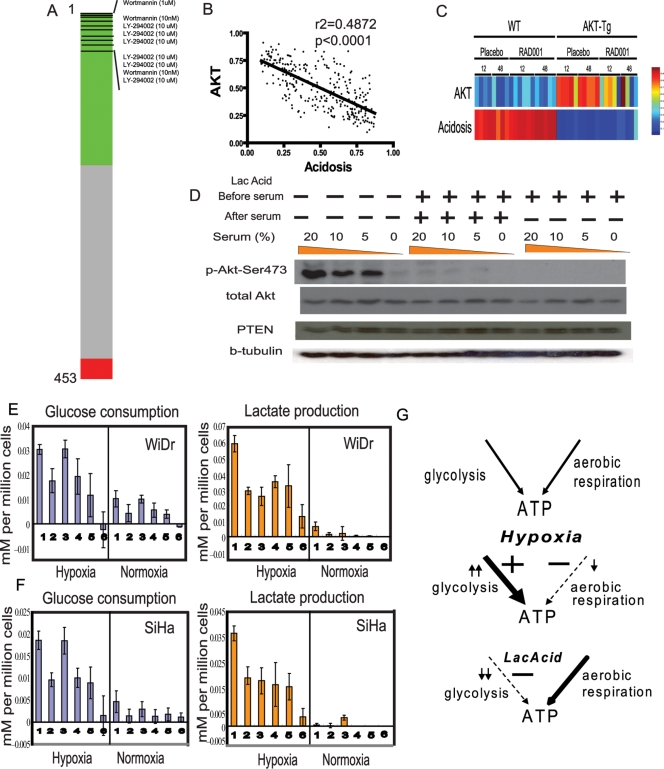
Figure 6. Lactic acidosis inhibits Akt and glycolytic phenotypes of cancer cells.
(A) PI3K inhibitors are highly ranked with lactic acidosis signature in the connectivity map analysis. The “barview” is constructed from 453 horizontal lines, each representing an individual treatment instance, ordered by their corresponding connectivity scores calculated with lactic acidosis signature (+1, top; −1, bottom) with the instances corresponding to wormannin and LY-294002 were shown as black bars. Colors applied to the remaining instances reflect the sign of their scores (green, positive; gray, null; red, negative). (B), (C) The relationship between the predicted Akt and Acidosis pathway activities in the gene expression pattern of a breast cancer expression studies (B) and prostate tissue is shown between wild (WT) and Akt transgenic mouse (AKT-Tg) treated with placebo or mTOR inhibitor RAD001. (D) The effect of lactic acidosis on Akt activation in DU145 cells during serum exposure. Indicated amount of serum are added to the DU145 which have been placed in 0.2% serum conditions for 24 hours without (−) or with (+) 25 mM lactic acid. The same amount of cell lysates of DU145 cultured under indicated conditions were separated, transferred to blot and probed with indicated antibodies. (E), (F) The amount (mM) of lactate production (orange) and glucose consumption (blue) in 48 hour per million of WiDr (E) and SiHa (F) cells under hypoxia (left) or normoxia (right) with the following media conditions (1) control, (2) 25 mM lactic acidosis (pH 6.7), (3) 25 mM sodium lactate, (4) pH 6.7, (5) pH 6.5, (6) pH 6.0. (G) The model of the differentially modulated the balance of glycolysis and aerobic respiration as means of energy generation under control, hypoxia and lactic acidosis.

