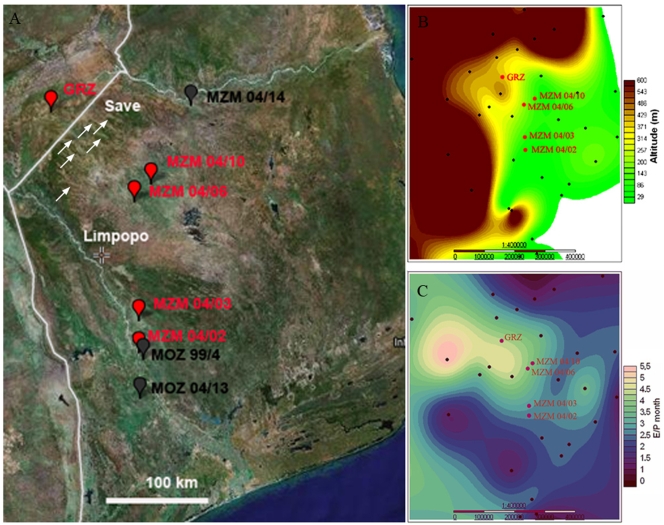
Figure 1. Location of N. furzeri habitats.
(A) GPS of habitats mapped using GPS Visualizer onto a GoogleEarth image. Red flags represent habitats for lines for which lifespan data were recorded. Save and Limpopo indicate the two major rivers that limit the distribution area. Small arrows point to intermittent streams originating on the Gona Re Zhou plateau. Black flags represent habitats for which no lifespan data were recorded, but specimens were included in the phylogenetic analysis. (B) The same habitats localized onto a GIS elevation map. (C) The same habitats localized onto a GIS interpolation of the ratio between evaporation and 30-year annual average precipitation. Meteorological stations used for GIS interpolations are indicated in black.

