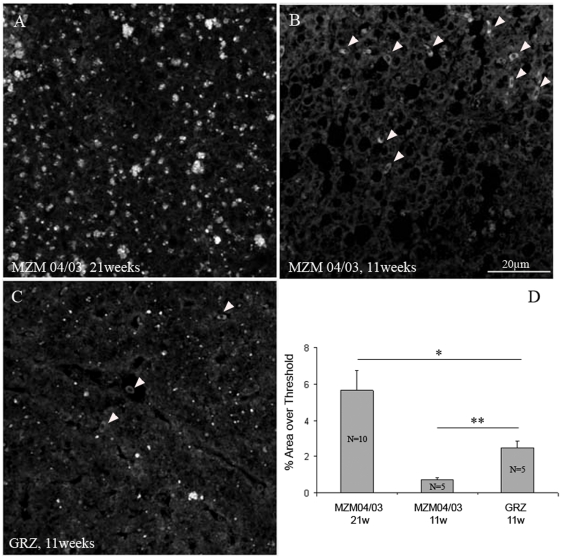
Figure 5. Lipofuscin in the liver.
Confocal images taken at an excitation wavelength of 488 nm. Images are projections of seven confocal planes at a distance of 1 µm. (A) Liver section from 21-week-old MZM-04/03. (B) Liver section from 11-months old MZM-04/03; white arrowheads point to autofluorescent erythrocytes, which were excluded from the analysis. (C) Liver section from 11-week-old GRZ; white arrowheads point to erythrocytes, which were excluded from the analysis. (D) Quantification of lipofuscin density based on percentage threshold area. Student's t-test, *P<0.05, **P<0.01.

