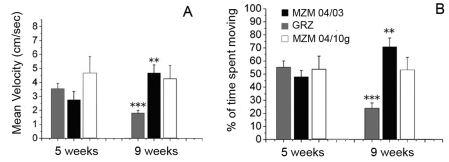
Figure 9. Age-dependent decrease in exploratory activity.
Exploratory activity was measured in an open-field setting [9] in terms of (A) mean velocity and (B) time spent moving. Error bars represent standard error of the mean. Sample size n = 10 for each age and population. Pairwise comparisons were performed exclusively within populations. Mann-Whitney U-test, **P<0.01, ***P<0.001.

