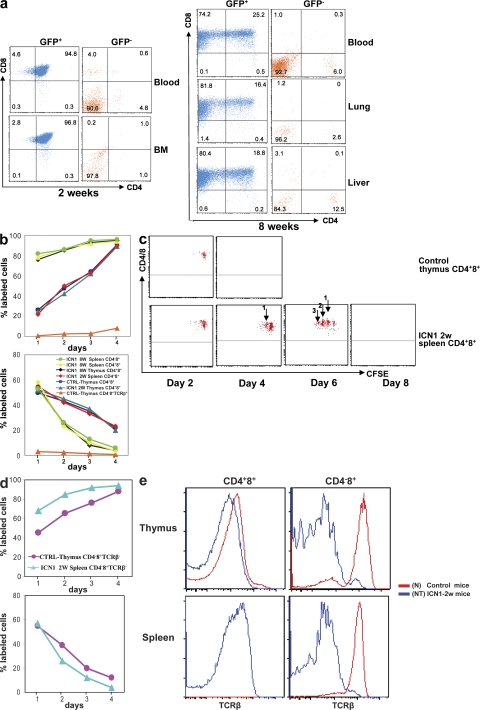
Figure 1.
Phenotypic analysis of GFP+ cells in various tissues after transplantation of ICN1-overexpressing BM cells. (a) Single-cell suspensions were prepared from blood and BM at 2 wk and from blood, lung, and liver at 8 wk after reconstitution with retrovirally transduced BM. GFP+ and GFP− cells were stained with CD4 and CD8 antibodies. Infiltration by GFP+CD4+8+ and GFP+CD4−8+ malignant cells was analyzed in nonlymphoid organs such as lung and liver. Numbers indicate the percentage of cells within each quadrant. Data are representative of three independent experiments. (b) BrdU–labeling kinetics: continuous (top) and pulse (bottom) BrdU labeling of lymphocytes subsets. BrdU was administered to control mice and mice at 2 or 8 wk after BM transplantation with ICN1-overexpressing cells. The percentage of BrdU-labeled cells was analyzed by flow cytometry as previously described (13). (c) CFSE labeling: normal CD4+8+ thymocytes and ICN1-overexpressing CD4+8+ splenocytes were labeled with CFSE and injected into nu/nu mice. Dilution of CFSE label was analyzed by FACS analysis. (d) BrdU–labeling kinetics: continuous (top) and pulse (bottom) BrdU labeling of ICN1-overexpressing TCR-αβ− CD4−8+ splenocytes versus control normal CD4−8+ thymocytes. (e) TCR-β expression by various lymphocyte subsets in ICN1-transplanted mice at 2 wk after BMT, as well as control mice. TCR-β staining was performed with the pan–TCR-β antibody H57.

