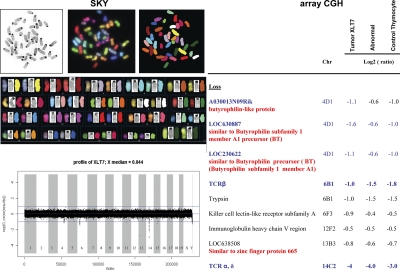
Figure 8.
Genomic analysis. (left) SKY analysis of ICN1-induced tumor cells. SKY table of stained ICN1-induced tumor chromosomes using SKY paint shows the spectral, classified, and banded-inverted chromosomes. (right) Array CGH. Genomic DNAs extracted from ICN1-induced malignant tumor GFP+CD4+8+ (Tumor XLT7), abnormal nonmalignant ICN1-overexpressing cells GFP+CD4+8+, and control GFP+CD4+8+ thymocytes were subjected to high-resolution oligo array–based comparative genomic hybridization. Tail DNA from the same mouse was used as reference for the hybridization. Malignant tumor GFP+CD4+8+ cells from four independent tumor mice were analyzed by Array CGH.

