Figure 5.
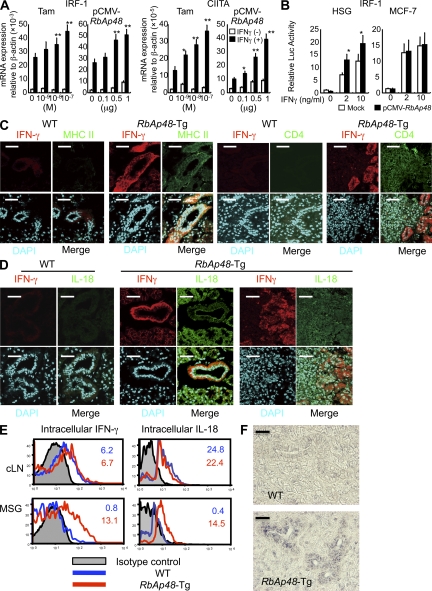
IFN-γ production from salivary epithelial cells stimulated with RbAp48. (A) IRF-1 and CIITA mRNA expressions of HSG cells stimulated with Tam (∼10−9–10−7 M) or transfected with pCMV-RbAp48 (∼0–1 μg) in the presence of IFN-γ (5 ng/ml) were detected by real-time PCR. Data are shown as means ± SE (SE) relative to β-actin mRNA of two independent experiments. *, P < 0.05; **, P < 0.005, versus IFN-γ (+) Tam 0 M or IFN-γ (+) pCMV-RbAp48 0 μg. (B) Promoter activity of IRF-1 in HSG and MCF-7 cells transfected with pCMV-RbAp48. Data are shown as means ± SE (SE) of two independent experiments. *, P < 0.05; **, P < 0.005, versus Mock (C and D) Confocal analysis of IFN-γ, MHC Class II, CD4, IL-18 or DAPI of salivary gland tissues from WT and RbAp48-TG mice at 32 wk of age. Alexa Fluor 488– or Alexa Fluor 568–conjugated anti–rat IgG were used as the second antibodies. Images are representative of three to five mice. (E) Intracellular IFN-γ and IL-18 expressions of cLN and MSG (without immune cells) cells from WT and RbAp48-Tg mice at 32 wk of age was detected by flow cytometric analysis. Results are representative and are shown as means ± SE of three mice of each group in two independent experiments. (F) The expression of IFN-γ mRNA in salivary gland cells of RbAp48-Tg mice was detected by in situ hybridization. Representative images of WT and RbAp48-Tg mice are shown in two independent experiments. Negative (antisense probe) or positive controls for mouse IFN-γ RNA probe are shown in Fig. S6 B. Fig. S6 is available at http://www.jem.org/cgi/content/full/jem.20080174/DC1. Bars: (C) 50 μm; (D) 40 μm.

