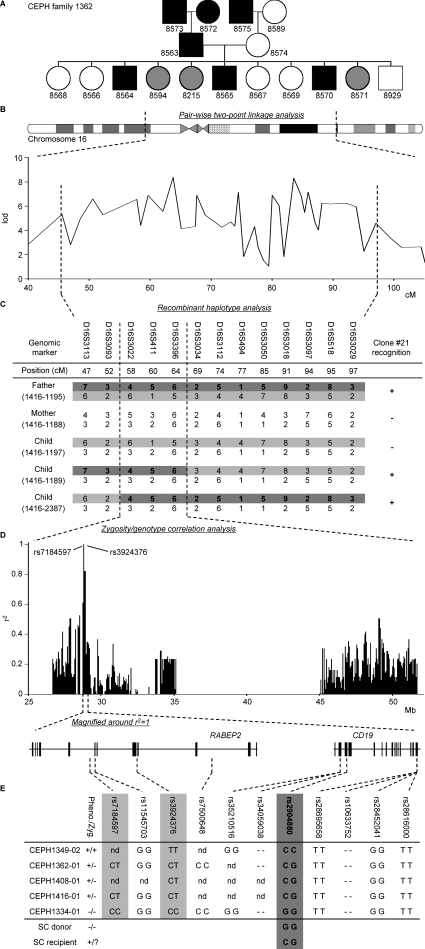
Figure 1.
Five-step identification of the SNP encoding for the mHag recognized by clone 21. (A) mHag phenotypes of CEPH families (indicated with Utah database ID numbers) were determined using methods described in the Materials and methods section. CEPH family 1362 is depicted as an example (male, square; female, circle; mHag+, black; mHag−, white; undetermined, gray). Phenotypes of families 1331, 1408, and 1416 are given in Fig. S1 (available at http://www.jem.org/cgi/content/full/jem.20080713/DC1). (B) Genome-wide pairwise two-point linkage analysis using the mHag phenotypes from families 1331, 1362, and 1408. Multiple significant lod scores >3 (at a recombination fraction of θ = 0.001) were identified on chromosome 16 in the depicted region. (C) Narrowing of the mHag locus using haplotype data from family 1416. As depicted, the mHag+ children 1189 and 2387 inherited the dark gray recombinant haplotype from the father, who is also mHag+. Thus the mHag locus was narrowed to the 16.8-cM region, which is defined by the shared part of the paternal allele of children 1189 and 2387. (D) Zygosity-genotype correlation analysis for fine mapping the mHag locus. The r2 values in the y axis represent the correlation between the mHag zygosity of 15 CEPH individuals (Table S1) with the genotypes for 4146 HapMap SNPs in this region. Each bar represents a single SNP. Two SNPs (rs7184597 and rs3924376) with 100% correlation (r2 = 1) are indicated. (E) The location of rs7184597 and rs3924376 (both light gray) in the intronic regions of the RABEP2 gene, which is neighbored by the CD19 gene. Also indicated are the nine nonsynonymous or transcription/translating-altering SNPs in these two genes. The mHag phenotypes and zygosities (Pheno./Zyg.) and the SNP genotypes for five informative CEPH individuals, the SC donor, and the SC recipient are depicted (−, deletion of the base pair). Only rs2904880 matched exactly with the phenotypes.

