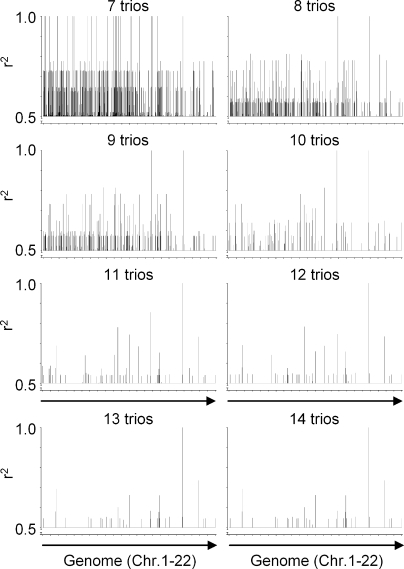
Figure 4.
Retrospective genome-wide mapping of the HMSD-mHag locus by zygosity-genotype correlation analysis. The correlation analysis of the HMSD mHag, using zygosity data from 7–14 CEPH trios, is depicted as a representative example. On the y axis, r2 values >0.5 are depicted representing the correlation between the HapMap-derived mHag zygosities of the CEPH individuals (Table S2, available at http://www.jem.org/cgi/content/full/jem.20080713/DC1) and the indicated number of trios with their genotypes for all HapMap SNPs (public release 23). The single r2 = 1 peak after analysis with 11 trios consisted of seven SNPs within the same LD block.

