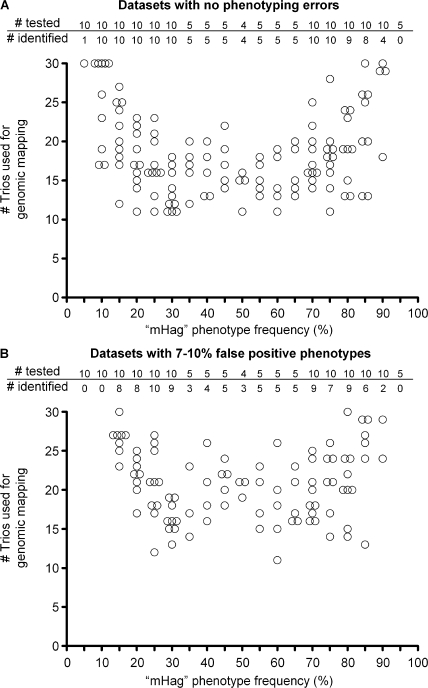
Figure 5.
Retrospective genome-wide mapping of nonsynonymous SNPs with various allele frequencies by zygosity-genotype correlation analysis. Summary of correlation analyses for 149 HapMap SNPs (Table S3, available at http://www.jem.org/cgi/content/full/jem.20080713/DC1). From each SNP one of the alleles was designated to encode for a fictive mHag. For each 5% mHag frequency interval between 5 and 95%, and 10, 5, or 4 mHags were analyzed. The analyses were executed for a dataset without phenotyping errors (A) or with 7–10% false-positive phenotypes (B). The false-positive phenotypes were introduced in the corresponding datasets by randomly changing −/− typings into +/−, avoiding Mendelian segregation errors. The criterion for positive identification is r2 = 1 at the genomic locus of the analyzed mHag without any r2 = 1 false-positive hits at other genomic loci (A), or the criterion is r2 is above the theoretical r2 (Fig. S2, available at http://www.jem.org/cgi/content/full/jem.20080713/DC1) at the mHag genomic locus without any false-positive r2 above this value at irrelevant genomic loci (B). The tables show the number of mHags analyzed for each frequency indicated below in the figures, as well as the number of successfully identified mHags. The figures show the number of used trios for only the successfully mapped mHags.

