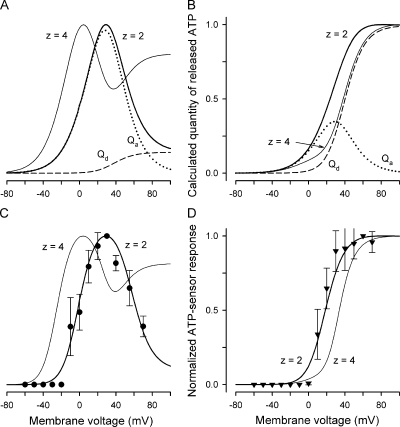
Figure 6.
Dependence of ATP secretion on membrane voltage. (A and B) Calculated quantity of ATP released on 2-s (A) and 100-ms (B) electrical stimulations. The thick lines depict the total ATP quantity versus membrane voltage calculated as QATP = Qa + Qd using Eqs. 11, 12, and 14 with the following parameters: G0 = 1, r = 0, V0 = RT/zF = 13 mV at z = 2, Vg and Vg0 as in Eq. 16, and with τa and τd determined by Eqs. 18 and 19, respectively. The dotted and dashed curves correspond to Eqs. 11 and 12, respectively, at the parameters mentioned above. The thin curve describes QATP = Qa + Qd calculated with z = 4 and the other parameters as above. Each dependence in A and B was normalized to the maximal value of QATP. (C) Normalized response of the ATP sensor (•) versus voltage clamped on the plasma membrane of an assayed taste cell. The ATP responses were recorded at 2 s of depolarization of taste cells. The thick and thin curves were obtained by converting QATP calculated at z = 2 and z = 4 (thick and thin curves in A, respectively) into ATP sensor responses using Eq. 20 with  = 0.49. Both experimental and simulated responses were normalized to the corresponding maximal value. (D) ATP responses (▾) recorded at the serial stimulation of taste cells by 100-ms pulses for 2 s. The thick and thin curves were obtained by converting QATP calculated at z = 2 and z = 4 (thick and thin curves in B) into ATP sensor responses using Eq. 20 with
  = 0.49. The responses were normalized to a value of the maximal response. The experimental data are presented as a mean ± SD (n = 5–8). The recording conditions were as in Fig. 1.

