Figure A1.
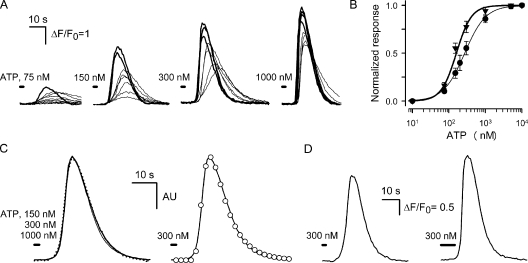
ATP-induced Ca2+ transients in Fluo-4–loaded COS-1 cells. (A) Superimposition of Ca2+ transients elicited by a 2-s application of 75–1,000 nM ATP in eight COS-1 cells assayed simultaneously. (B) Dose-response curves characterizing the whole population of tested COS-1 cells (•) and COS-1 cells selected as most sensitive to ATP (▾). The thick and thin lines represent the approximations of experimental dependencies with Eq. A1 at [ATP]1/2 = 160 nM and nH = 2 and [ATP]1/2 = 270 nM and nH = 1.5, respectively. (C; left) The superimposition of averaged (n = 4) responses to ATP applied at the concentration of 150 (dotted line), 300 (thick line), and 1,000 nM (thin line) for 2 s. Each response was normalized to its magnitude. (Right) The fit (○) of the averaged response to 300 nM ATP (solid line) with Eq. A2 at α = 0.32 s−1, β = 0.15 s−1, and t0 = 8.1 s. AU, arbitrary unit. (D) Averaged (n = 4) responses to 300 nM ATP applied for 2 (left panel) and 8 s (right panel). In C and D, all responses were recorded from COS-1 cells selected by their high sensitivity to ATP (thick lines in A). In all cases, cells were incubated in the basic extracellular solution and stimulated by bath application of ATP dissolved in the same solution.

