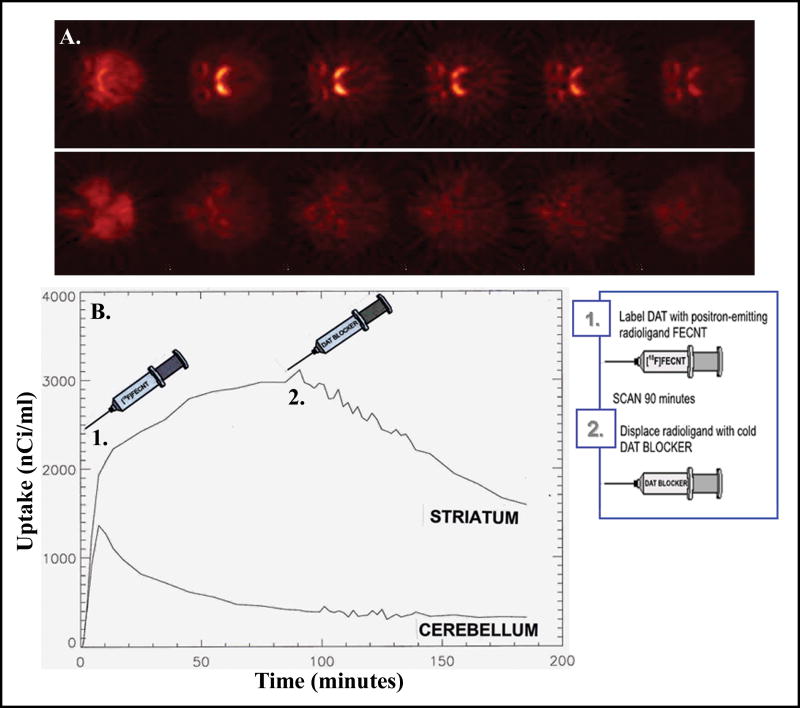
Figure 3.
A. Representative images from a single rhesus monkey showing binding of the selective DAT radiotracer [18F]-FECNT at the level of the striatum (top row) or the cerebellum (bottom row). Images from left to right in each row represent increasing time over the course of the scan. Unlabelled cocaine was administered i.v. before the third image. Binding of [18F]-FECNT is rapidly and significantly reduced in the final three images. B. Representative time-activity curves from the striatum and cerebellum in the same subject depicted in panel A. Time points are identified for the administration of [18F]-FECNT (1) and cocaine (2). Abscissae: Time in minutes. Ordinates: Uptake within a given brain region in nanoCuries per milliliter.

