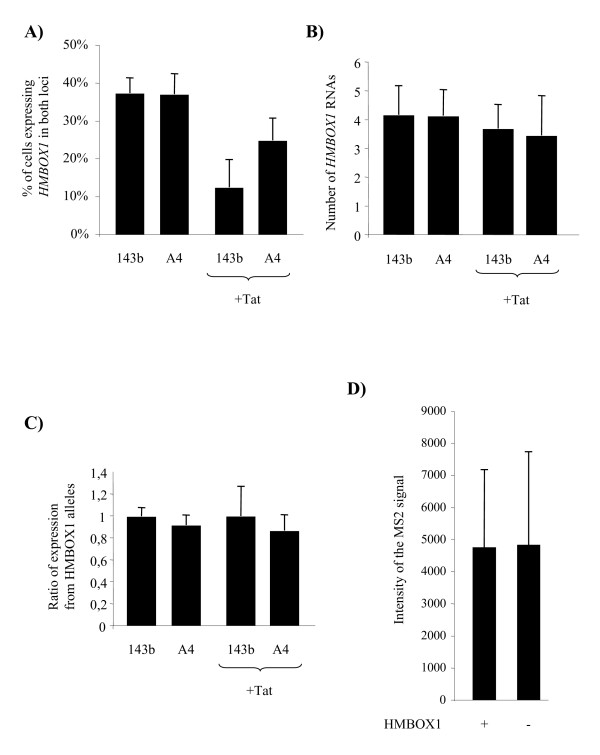
Figure 6.
A) The number of cells expressing HMBOX1 in both loci before and after Tat-EGFP transfection is shown. B) The number of HMBOX1 RNAs on the transcription spots before and after Tat-EGFP transfection is shown. C) The ratio between the intensity of the hybridization signals on the transcription spots of the HMBOX1 alleles is shown. D) The intensity of the MS2 hybridization signal on HIV-Intro transcription spots is shown both on a HMBOX1 active and inactive background.

