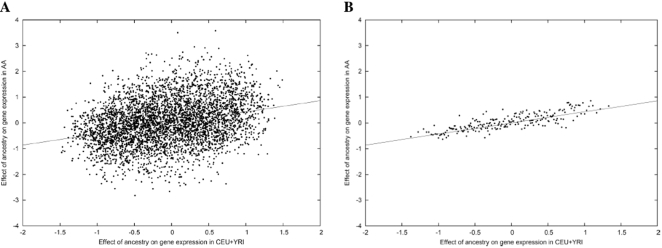
Figure 2. Gene expression differences between CEU and YRI are validated in AA samples.
The y-axis shows the difference in normalized gene expression due to ancestry estimated from AA samples (ãg ,AA) and the x-axis shows the difference in normalized gene expression due to ancestry estimated from CEU and YRI samples (ãg ,CEU+YRI) (see Materials and Methods for details of normalization). (A) We plot each of the 4,197 genes separately. (B) For aid in visualization, the 4,197 genes are averaged into bins of 20 genes according to values of ãg ,CEU+YRI; binning does not affect the slope of the plot. The slope of each plot is our estimate 0.43 of the parameter c.

