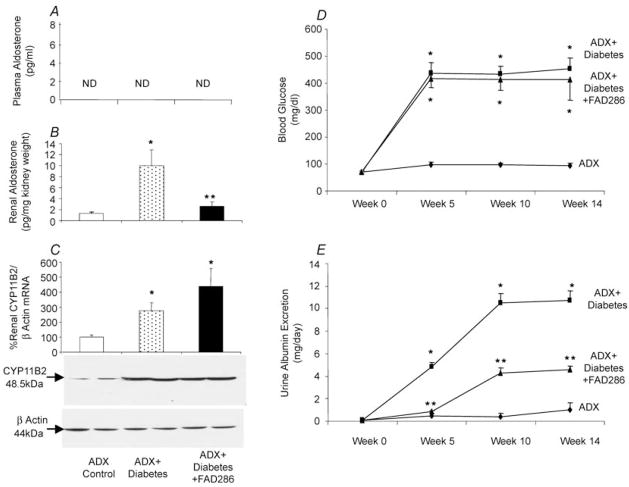
Figure 1. Plasma aldosterone (A), renal aldosterone (B), representative renal aldosterone synthase (CYP11B2) mRNA (C, upper panel) and protein (C, lower panel), blood glucose (D) and urinary albumin excretion (E) in adrenalectomized (ADX) normoglycaemic (ADX control), adrenalectomized diabetic (ADX + Diabetes) and adrenalectomized diabetic rats treated with the aldosterone synthase inhibitor FAD286 (ADX + Diabetes + FAD286).
* P < 0.01 from control; **P < 0.01 from control or ADX + Diabetes. n = 8 each group.

