Figure 4.
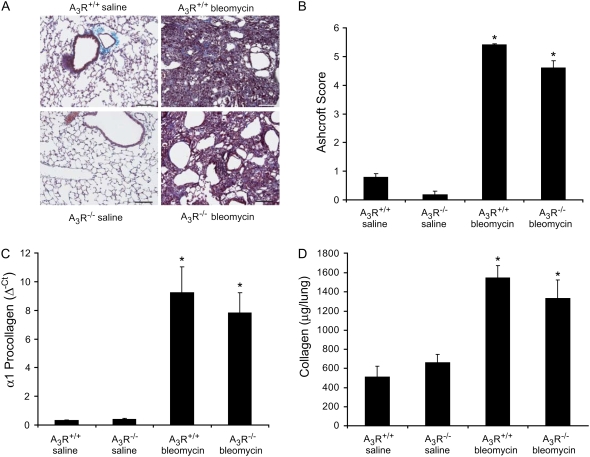
Pulmonary fibrosis in A3R+/+ and A3R−/− mice. (A) A3R+/+ and A3R−/− mice were killed 14 days after saline or bleomycin exposure, and the lungs were processed for Masson's trichrome staining. Photographs are representative of six to eight mice from each condition; scale bars = 100 μm. (B) Ashcroft scores were determined by examining multiple sections from lungs of mice from each condition. Data are presented as mean Ashcroft score ± SEM (n = 6–8 lungs per condition). (C) RNA was extracted from the lungs of mice 14 days after saline or bleomycin exposure, and α1 procollagen levels were quantified using quantitative rtPCR. Values were normalized to 18S ribosomal RNA and are presented as mean normalized transcript levels (Δ−Ct) ± SEM (n = 6–8). (D) Collagen protein levels were measured in whole lungs 14 days after saline or bleomycin exposure using the Sircol assay. Data are presented as mean μg collagen per lung ± SEM (n = 6–8). *Significant difference from saline-treated A3R+/+ mice (P < 0.05).

