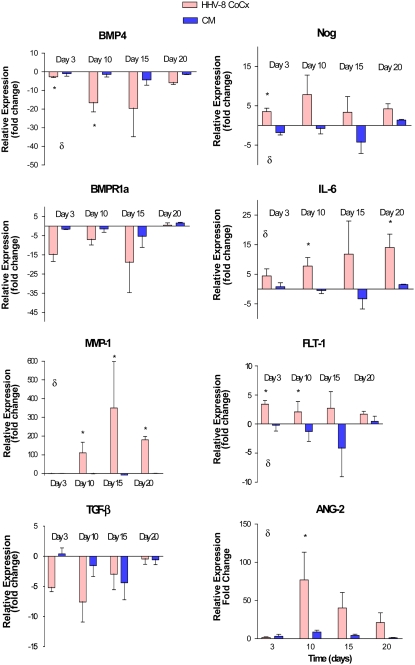
Figure 6.
q-PCR of genes in HMVEC-L infected with HHV-8 via co-culture technique compared with cells exposed to conditioned media and untreated cells (media alone). The y-axis represents gene expression fold change compared with untreated cell gene expression. Expression was assayed at four time points: 72 hours, Day 10, Day 15, and Day 20. All samples were run in triplicate. Error bars represent SEM. δ indicates P < 0.05 (two-way ANOVA). *P < 0.05 (post-test infection versus conditioned media).

