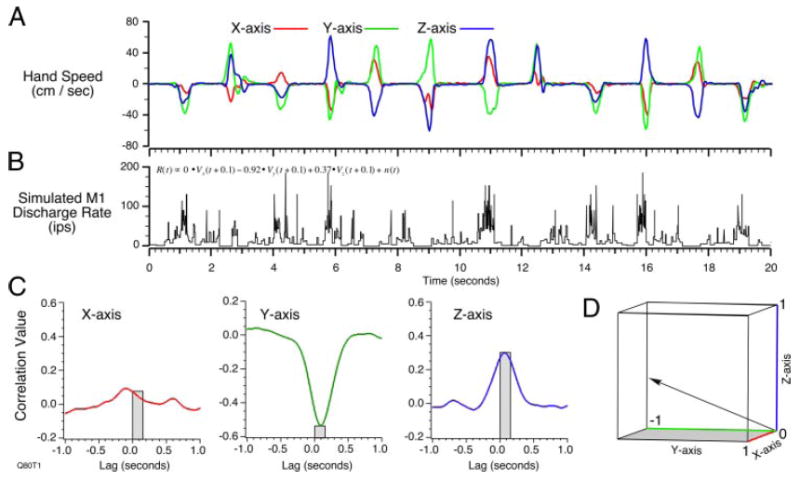
FIG. 1.

A: X, Y, and Z components of the hand velocity generated during a series of hand movements. B: simulated spike discharge conforming to a known preferred direction (PD) (0.0, −0.92, 0.37) and the trajectory in A. C: cross-correlations between discharge rate (B) and each component of hand velocity (A), where the 0- to 150-ms time lags are indicated by the gray boxes. D: vectors representing original PD and 2 estimates, (regression over target direction) and (cross correlations). This projection preserves the size of the 3-dimensional (3D) angular error for both estimates.
