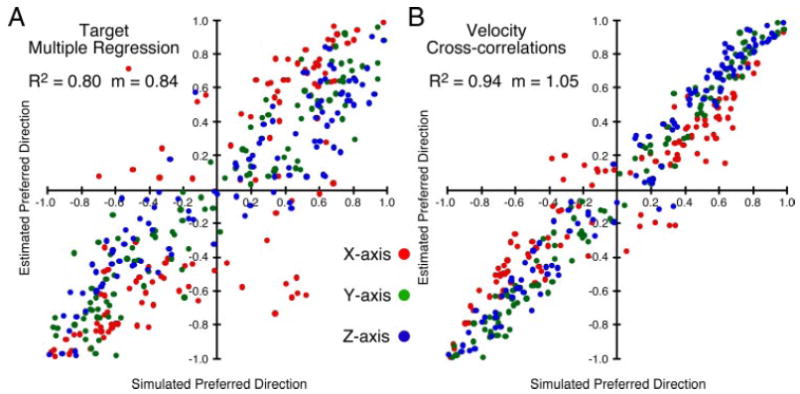
FIG. 2.

Summary of the linear regression (A) and cross-correlation (B) approaches to the estimation of PD: 100 different data sets of the type shown in Fig. 1 were generated and used to estimate PD. Estimated components of each of the PDs are plotted against the corresponding known components. Better estimates provided by the cross-correlations probably resulted because many of the hand trajectories did not follow the straight lines to the intended targets implicitly assumed by the regression method.
