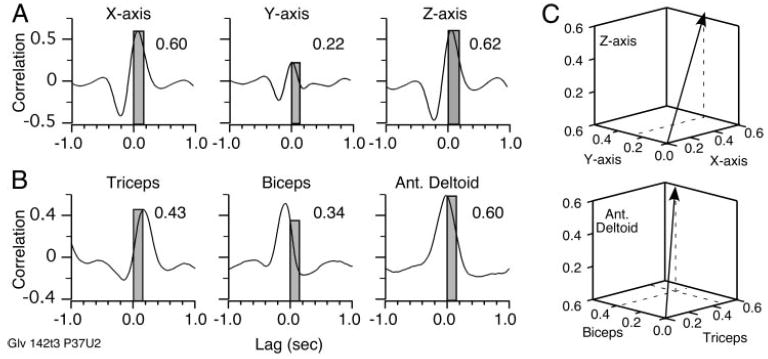
FIG. 4.

Cross-correlations between discharge rate and hand velocity components (A) and EMG signals (B). Peak strength of each correlation within the 0- to 150-ms range of lags was the basis for one of the components of the PD vector (C). PDM was actually constructed from more muscles than the 3 that can be conveniently displayed.
