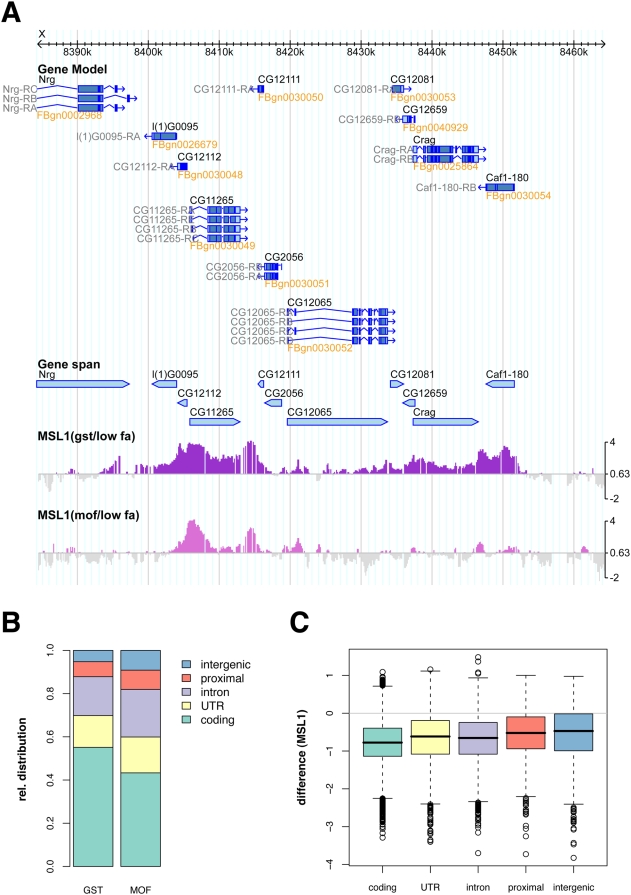
Figure 3. Changes in MSL1 binding after MOF RNAi.
A) Genome browser snapshot of a representative region with MSL1 profiles after control (top) and MOF (bottom) RNAi. B) Changes of the relative distribution of significant MSL1 binding. C) Changes in MSL1 signal after MOF RNAi as compared to the signals after GST RNAi. Probes are grouped according to their functional annotation.

