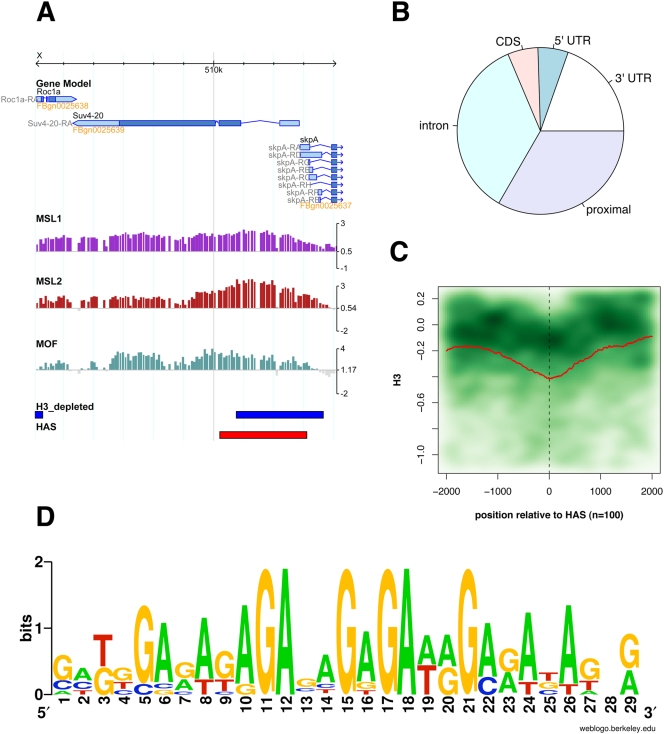
Figure 6. Common features of X-chromosomal high-affinity sites.
A) A high affinity site (HAS, red box) within the Suv4-20 gene. Displayed are wild type profiles for MSL1, MSL2 and MOF. Regions that are significantly depleted of histone H3 are indicated by blue boxes. B) Location of 51 high-affinity sites with respect to functional genomic context. “Proximal” indicates location within 3 kb up- or downstream of annotated genes. C) Cumulative H3 profile of 100 high-affinity sites. The red line indicates the mean signals along a region from −2 kb to +2 kb from the center of each high affinity site. The green cloud resembles the kernel density plot of all signals contributing to the mean. A darker color indicates higher density. D) Top motif found enriched in high-affinity sites and 1.5-fold over-represented on the X chromosome.

