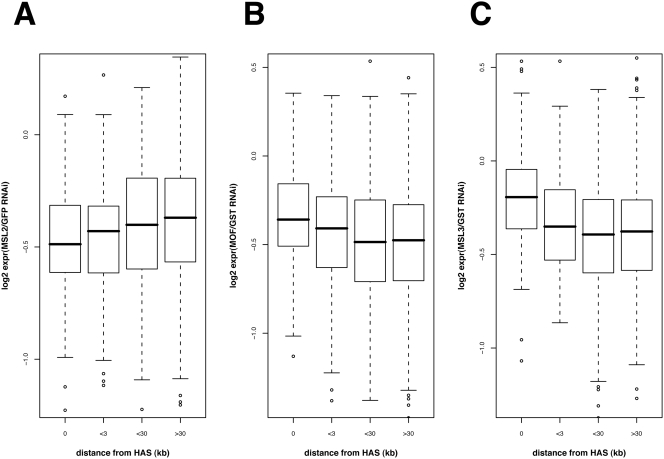
Figure 8. Compensation of X-linked genes is dependent on distance from high-affinity sites (HAS).
Based on microarray expression profiling studies the relation of mean fold changes (log2) in gene expression after RNAi and the genes' distance from the closest HAS is depicted. A distance of 0 indicates that the HAS is directly within the gene. Effects of MSL2 (A), MOF (B) and MSL3 (C) knockdown are displayed as boxplots on gene groups of varying distance. For clarity, extreme outliers have been omitted from the panels. Genes located more than 3 kb away from the next HAS respond significantly less to MSL2 RNAi (p-value 0.00087; two-sided t-test). On the contrary, upon MOF and MSL3 RNAi these genes are stronger affected (p-value 3.115e-05 and 5.804e-08, respectively).

