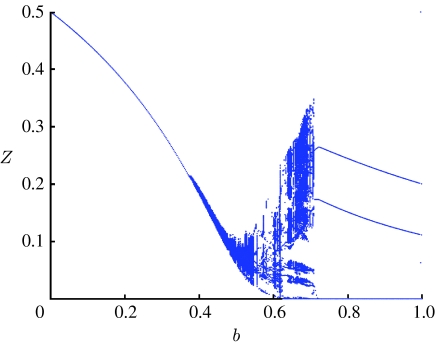
Figure 1.
Bifurcation diagram plotting local maxima (taken from the last 5000 years of a 15 000 year solution of the model) of the proportion immune to each strain, Zi, as a function of the cross-immunity parameter b. The plot illustrates the different types of dynamical behaviour of the model obtained as b varies. R0=2 and the recovery rate σ=50/year.

