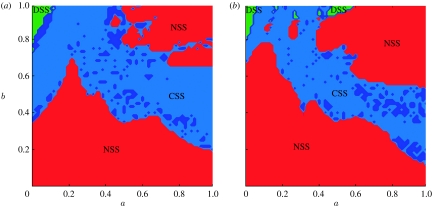
Figure 3.
Dynamical maps for the models with (a) five locus three allele genotype and (b) eight locus two allele genotype. Parameter a (OX axis) characterizes decay of cross-immune response with genetic distance and b (OY axis) is the maximum cross-immunity level. In red areas, marked as NSS (no strain structure), dynamics converge to a point attractor with all strains present at constant prevalences. Light blue marks areas of CSS where quasi-periodic oscillations of prevalence occur. Dark blue indicates the small regions of pure periodic behaviour. Light green zones indicate DSS, where cross-immunity causes the system to self-organize into discordant (antigenically non-overlapping) sets of strains at constant prevalence.

