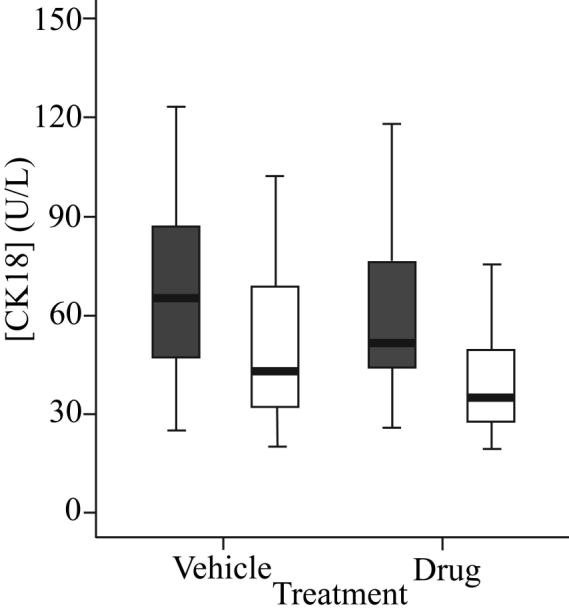
Figure 3. Variation in pre-dose (baseline) levels of M30 and M65.

One way ANOVA followed by a post hoc Bonferonni analysis was carried out to test for significant variation in 24 h pre-dose (baseline) levels of M30 (grey bars) and M65 (white bars) antigens in vehicle and ABT-737-treated animals.
