
Figure 2.
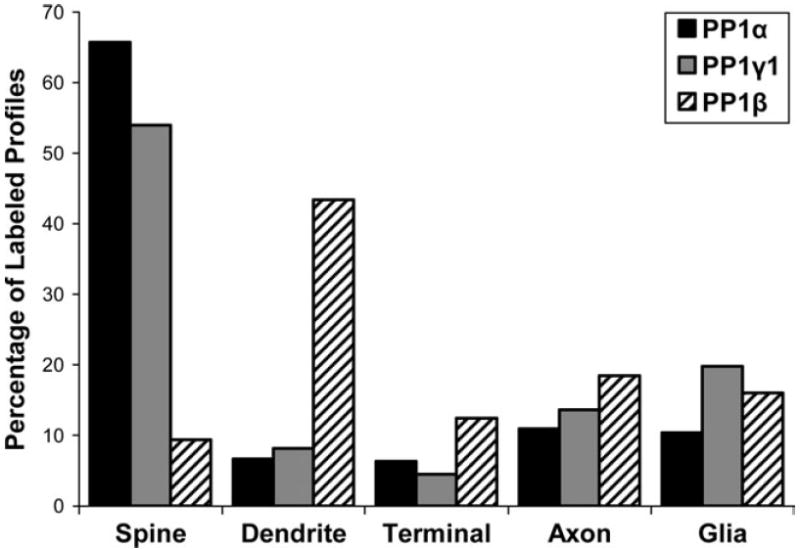
A histogram showing the relative abundance of labeled elements for PP1α, PP1γ1 and PP1β in the neuropil of primate PFC. The distribution of immunoreactive profiles is significantly different between the isoforms (χ2 = 562.389; P < 0.0001).
Official websites use .gov
A
.gov website belongs to an official
government organization in the United States.
Secure .gov websites use HTTPS
A lock (
) or https:// means you've safely
connected to the .gov website. Share sensitive
information only on official, secure websites.
A histogram showing the relative abundance of labeled elements for PP1α, PP1γ1 and PP1β in the neuropil of primate PFC. The distribution of immunoreactive profiles is significantly different between the isoforms (χ2 = 562.389; P < 0.0001).