
Figure 5.
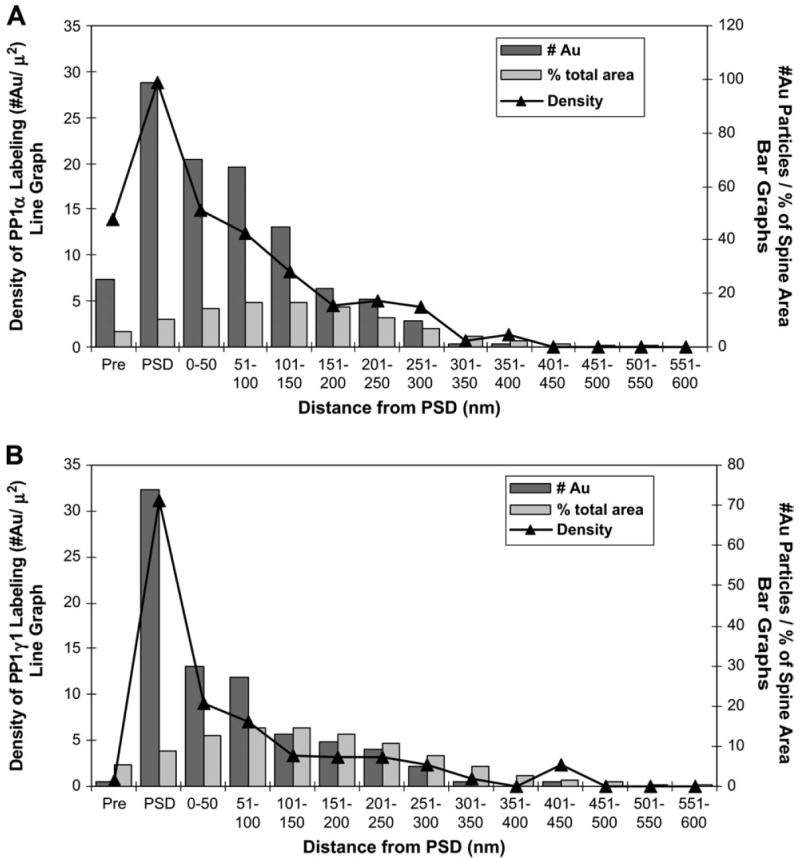
Graphs illustrating the distribution of immunogold labeling for PP1α (A) and PP1γ1 (B) within dendritic spines. A total of 207 spines containing immunogold label for PP1α and 130 spines containing immunogold label for PP1γ1 were divided into bins of 50 nm width, starting just below the PSD. In addition, a presynaptic bin consisting of the 25 nm immediately presynaptic to the PSD was drawn. For each spine, the area of PSD and each bin was determined, as well as the number of gold particles in each bin. These values were then summed across all the spines of the sample and the density of gold label in each bin was calculated. On these graphs, the number of gold particles in each bin is represented by the dark bars, and the fraction contributed by that bin to the total spine area is shown by the light bars (refer to right y-axis for both). The density of gold label in each bin is shown by the line graph (refer to left y-axis). For PP1α and PP1γ1, the highest density is seen in the PSD. However, PP1α label density remains relatively elevated in the 150 nm immediately subjacent to the PSD, whereas PP1γ1 label density falls dramatically in the 50 nm subjacent to the PSD and continues to decline to very low levels throughout the remainder of the spine. Strikingly, PP1α label density in the pre-PSD is almost as high as that found 50 nm subjacent to the PSD, while PP1γ1 label density in this same bin is less than one. No gold label was seen beyond 400 nm for PP1α and 450 nm for PP1γ1; however, as indicated by the light bars, this region contributed minimally to the total area of the sample and insufficient area may have been sampled to obtain a reliable estimate of PP1α and PP1γ1 density there.