
Figure 8.
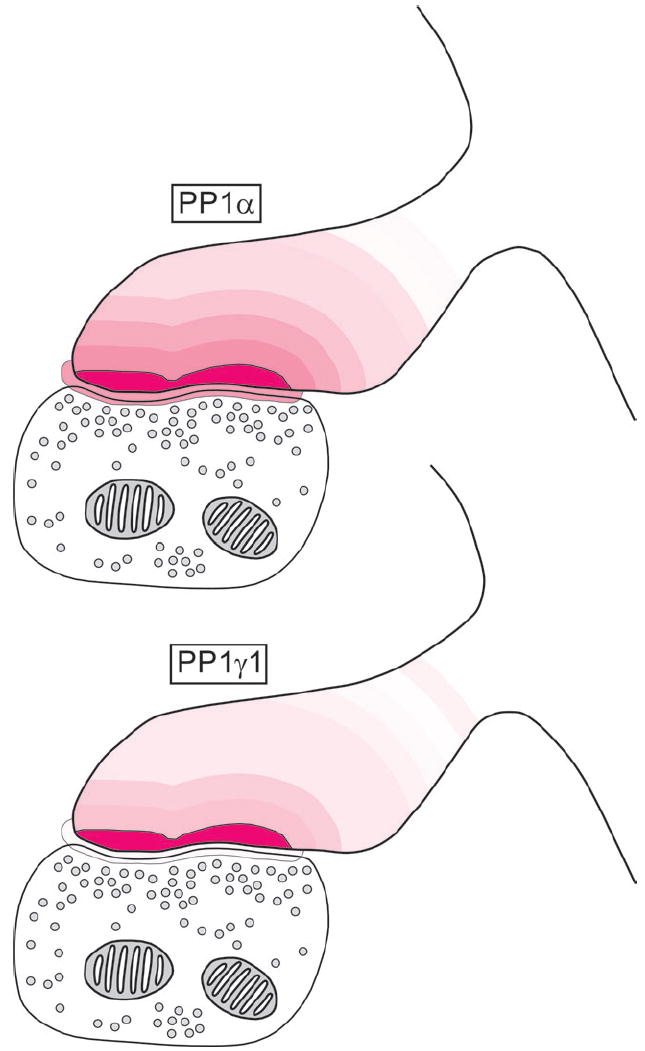
Summary of the density of PP1α and PP1γ1 immunoreactivity in spines of monkey PFC. For each protein, the model axospinous synapse is binned and each bin is given the identical color. The density of labeling in each bin is indicated by setting the transparency of the color to the percentage of the maximum density observed for each protein (PSD for both). For example, for PP1α the PSD is indicated by 100% color opacity, while the bin from 1–50 nm is indicated by 51.35% color opacity to reflect their gold labeling densities of 28.89 and 14.83 gold particles/μm2 respectively.