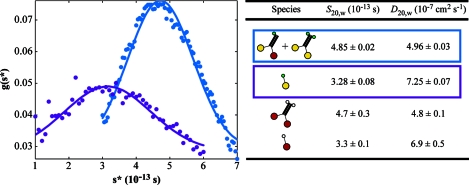
Figure 1.
Population distributions (g) of apparent sedimentation coefficients (s*) in sedimentation velocity experiments on the heterodimer (blue) and mutant monomer (purple) samples (left). Circles are measurements; lines are theoretical non-interacting single-species distributions using the sedimentation and diffusion coefficients (right, rows 1 and 2) determined by fitting (see Materials and Methods). Cartoons show the domain structures of protein species in the samples: red, wild-type head; yellow, R210K mutant head; thick black, neck coiled-coil; green, biotin and six-histidine tags; white, biotin tag. Wild-type data (right, rows 3 and 4) from ref (5) are included for comparison.

