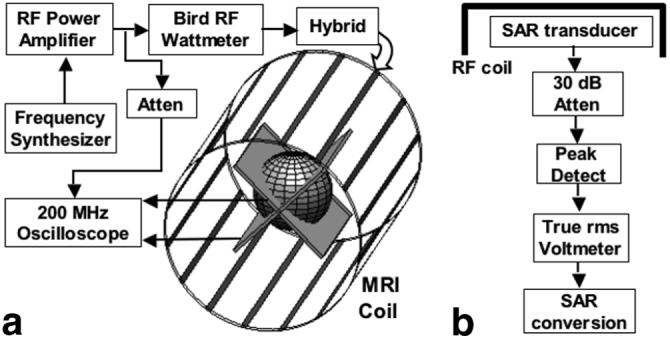
Figure 3.

a: Block diagram of the experimental setup used for calibration. The frequency synthesizer (a PTS 160) connects to an ENI MRI-2000 RF power amplifier, whose output is monitored by a Bird 4410A RF Wattmeter at the input to the quadrature hybrid on the MRI head coil. Voltage across the transducer reference resistors are monitored by a 200 MHz oscilloscope, which is also used to cross-check the input power. b: Block diagram of the proposed SAR dosimeter, with readout in W/kg.
