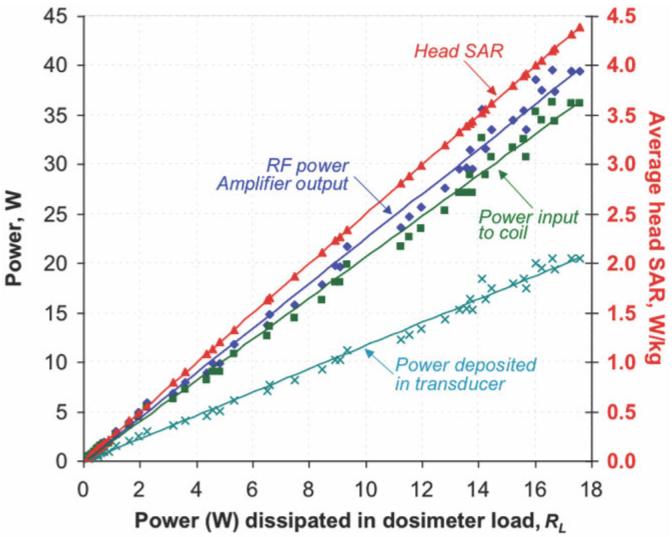
Figure 5.

Power and SAR measurements from the prototype SAR dosimeter. The measured output power from the RF amplifier (blue diamonds and line of best fit), the measured input power to the birdcage coil (incident minus reflected power; green squares and line), and the total power deposited in the transducer as deduced from Eq. [1] (cyan crosses and line), all as a function of the power measured on the dosimeter load RL on the horizontal axis. The cyan curve relating actual-to-measured power in the dosimeter, is used for calibration. The red line (red triangles) plot the SAR (vertical axis at right) for the average head in W/kg, as a function of the power measured in RL on the horizontal axis. [Color figure can be viewed in the online issue, which is available at www.interscience.wiley.com.]
