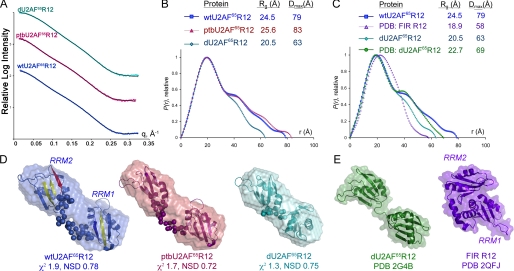
FIGURE 2.
Small angle x-ray scattering analysis of U2AF65 R12 variants. Color schemes are consistent throughout: U2AF65 sequences, blue; PTB variants, maroon. A, experimental x-ray scattering profiles as compared with data calculated from the most typical BUNCH model (solid lines). Scattering intensities from the low q-region for short exposures and high q-region for long exposures were integrated and merged to achieve the experimental scattering profiles shown. The relative scattering intensities are arbitrarily displaced along a logarithmic y axis for clarity. B, comparison of P(r) functions for wtU2AF65R12, ptbU2AF65R12, and dU2AF65R12 calculated from the experimental scattering profiles using the program GNOM (31). The functions are presented in arbitrary units. The radius of gyration (Rg) and maximum intraparticle size (Dmax) of the variants are in the inset. C, the P(r) functions calculated from the experimental dU2AF65R12 or wtU2AF65R12 scattering data, respectively, as compared with data calculated from the protein coordinates of the dU2AF65R12 (PDB ID 2G4B) or FIR R12 structures (PDB ID 2QFJ) using the program CRYSOL (46). D, envelope restorations of wtU2AF65R12 (colored as in Fig. 1B), ptbU2AF65R12, and dU2AF65R12. Mean ab initio shapes resulting from the program GASBOR (32) are superimposed with the most typical model built by the program BUNCH (33). For the BUNCH models, the ab initio models of the inter-RRM linker regions are shown as spheres, and the rigid body models of the individual RRMs are depicted by ribbon diagrams. The mean χ2 value for the GASBOR models and the NSD value of the most typical BUNCH model are given. E, for comparison, the solvent accessible surfaces and ribbon diagrams of the dU2AF65R12 and FIR R12 coordinates are shown following removal of nucleotides. The locations of RRM1 and RRM2 are indicated for wtU2AF65R12 and FIR R12, and remaining models are oriented similarly. Panels D and E were drawn using PyMOL.

